A's Minors Midseason Statistical Check-In, Part 3: Offensive Batted Ball Distributions
- Nathaniel Stoltz
- Jun 21, 2022
- 15 min read
In Part 1 of this series, I looked at the leaders and laggards in the A’s minor league system in a variety of basic* offensive statistics (the triple-slash stats, wOBA, and wRC+). In Part 2, I did the same with the system’s pitchers (the triple-slash stats, ERA, FIP, and xFIP). In Part 3 here, we’re returning to the position player group, but moving on to a different set of statistics: those dealing with batted balls.
*I should probably note that I’m using “basic” here more in reference to these statistics’ generality–purportedly accounting for large portions of players’ value–not their mathematical complexity; I know something like wRC+ is not a “basic” statistic in the latter sense.
When we check in on the production of minor leaguers, we often focus on the sorts of numbers I broke down in the first two parts of the series, along with perhaps walk and strikeout rates (which will lead off Parts 5 & 6 a little later). This focus is understandable: those are the statistics that give us the best quick sense of how a player is faring at his current assignment. But batted ball statistics, along with some other plate discipline statistics that I’ll look through in later installments, give us a clearer sense of the process behind players’ production. Of course, that process can be most deeply understood by actually watching the players and getting a visual sense of their mechanics, approach, skillset, and weaknesses, which I’ve done extensively. But these statistics–ground balls vs. fly balls vs. line drives, pull vs. up the middle vs. opposite field, homers per fly ball, and batting average on balls in play–act as a sort of middle ground between the specificities one may derive from observation and the general performance summations suggested in the opening two parts of this series. They are thus nice conduits for some discussion about what visually seems to be driving particularly striking hit distributions, whether those distributions seem to match up with the eye test, and whether high rates in each statistic seem to be helping or hindering different players overall.
As with the first two installments, I’ll be looking here mostly at lists of the top ten A’s position players of the statistics mentioned above. Unlike those installments, however, I’ll mostly only be working with the top ten and not the bottom ten, because the players at the bottom of the groundball rate list are mostly those who are high on the flyball rate list, and the same for pull vs. opposite field rates. So we’ll be discussing the players who have the most pronounced distributions of hits in both those senses in all possible directions while avoiding needless repetition.
To appear on these lists, a player must still be prospect-eligible and had at least 45 plate appearances at a full-season A’s affiliate. We'll start off by looking at the distribution of batted ball types: ground balls, fly balls, and line drives.
Groundball Rate
As ground balls are the most frequently-hit of the three main batted ball types, groundball rate has some of the lowest statistical noise among what is going to be an admittedly volatile group of statistics we're looking through here. Here are the A's prospects who hit the ball on the ground most frequently:

Since there are 55 players eligible for these lists, what we’re essentially looking at here is the top 18% of batters in each statistic. If I look at what the 82nd percentile for groundball rate among qualified MLB batters is, it’s around 48.5%, a number well eclipsed by our tenth place finisher here (48.5% would rank about 15th in the system).
That might seem alarming, but most of these players have not had consistent playing time this year: only Puason and Diaz have eclipsed the 130 PA mark. Diaz is pretty shocking to see here, since he not only is tied for the organizational lead in home runs (with 12), he also paces it in doubles by a wide margin (with 21; nobody else has even 15). He was up around 53% in Lansing last year, so this isn’t out of character for him, but as a 20-grade runner, Diaz doesn’t really have much reason to be aiming for this kind of hit distribution. It’s obviously working so far, though, which makes one wonder if even more pop can be unlocked if Diaz can get the groundball rate down ten percent (maybe more selectivity would help here?). Puason also has good raw power that would seem to be ill-fitted for this groundball-heavy approach (though he runs way better than Diaz), but he hasn’t been able to get good results from it, and was in fact demoted to the ACL yesterday after a frustrating year and a half in Stockton. His downward-sloping cut has produced this sort of groundball number for two consecutive seasons. Like Diaz, he’s a very free swinger, but he hasn’t shown Diaz’s feel for barrelling pitches.
Among the more small-sample players, some of these guys are nicer to see on this list than others. Obviously, contact/speed-oriented hitters are still going to fare their best when hitting line drives, but you’d rather have guys like Ricciardi, Valenzuela, Jackson, and Wright slashing grounders than trying to backspin balls over the fence. Jackson has an average exit velocity of just 84.7 mph this season in Las Vegas, which would rank in MLB’s bottom ten hitters, and has good speed, so fly balls are certainly not going to help him. Jalen Greer also has some speed, though he also boasts some raw power that hasn’t come into games much yet, but he’s had a ton of trouble making contact in the first place and tends to roll his wrists over the ball on the occasions he does.
McGuire and especially McColl are the names that are most disappointing to see on the list, since neither runs well. McGuire is a catcher with terrific feel for the strike zone but a very conservative swing aimed at flipping the ball over the infielders’ heads more than anything else. McColl has a ton of raw power in his 6’6” frame but has struggled to find consistent bat speed as a pro. Like Greer, both tend to be late on velocity–they all have opposite-field-oriented spray charts, which we’ll talk about later–and end up often rolling over even high fastballs. Uhl is a defensive-minded catcher with a very conservative approach at the plate, choking way up on the bat to make contact; he doesn’t swing very hard and also focuses on poking stuff the other way.
Among this group, Diaz, McGuire, and to some extent Jackson (87 wRC+, but .380 OBP) are having good seasons. The others are struggling, though, and thematically the common link seems to be the trouble with velocity, with six of the other seven batters (all but Puason) struggling with high heaters and finding it difficult to pull the ball with any frequency.
Flyball Rate
We’ll approach flyball rate in a couple of different ways. First, here are the overall flyball rate leaders in the system.

Compared to the groundball leaders, this is a more notable set of names, with a couple of the team’s most notable offensive prospects and only one player with fewer than 100 plate appearances.
At first glance, the two guys who might appear somewhat surprising on here are Buelvas and Lopes, who are both known as more gap-oriented hitters than over-the-fence guys. Lopes in particular is surprising to see, considering that you’d think this amount of fly balls would lead to something more than his anemic .305 slugging percentage in Vegas; though his exit velocity numbers aren’t great (85.5 mph average, 89.7 median), you’d have to think the power will uptick a bit as the season progresses. He actually was all the way up at 52% fly balls for Arizona’s AAA affiliate (Reno, a similar launching pad to Vegas) last year and slugged .497.
Most of these hitters have significantly lofted swings geared for pull power. The swings of Paulino, Eierman, Langeliers, Cross, and Brueser in particular are geared for low-ball contact. Armenteros’ swing tends to be more suited to launching letter-high fastballs, which has traditionally led to him rolling over a lot of stuff from the belt down, but his flyball rate is way up this year relative to his career norms, and he’s been getting to more of his huge raw power. Richards and especially Beck bring a bit more plate coverage.
Not all fly balls are created equal, though, so let’s look at the leaders in outfield fly rate and infield fly rate separately. Outfield fly balls, especially for power-oriented guys like most of the players on the last list, can be a good thing, but infield flies aren’t good for anyone but the opposing pitcher. First, here are the outfield fly ball leaders:

Paulino again leads the pack, and then hey, look at that: Armenteros and Beck have been discussed in tandem for years, initially positively and then in more frustrating terms over the past few seasons, but they rise to the top of the system on this metric. We’ve got a lot of the same names overall here, with Schwarz and Pineda sneaking on the back end. Pineda struggled significantly to make contact in Stockton and seems to currently be retooling in the ACL (he hasn’t played in any games yet, so might just be there in a development capacity), but there is natural lift in his swing and like Armenteros, he managed to get to his power in games despite a strikeout rate north of 40%. Schwarz hit the ball very hard in his short early-season stint in Vegas, leading the Aviators with a 92.2 mph average exit velocity, and he’s performed well in Midland, but he has more of a line drive-oriented approach and doesn’t have as much of a flyball-heavy history.
Here are the system leaders in the worse kind of fly balls: those that stay on the infield:*
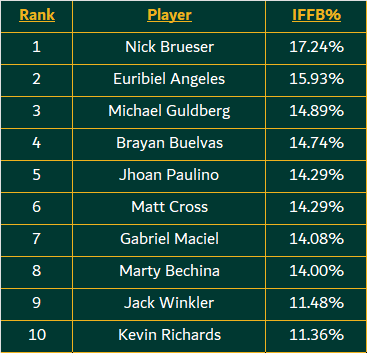
*The way IFFB% is usually calculated is "percentage of fly balls that stay on the infield," but here I'm using "percentage of all batted balls that are infield flies."
Generally speaking, I don’t want to make too big of a deal out of this. Infield fly balls happen less frequently than all other types of hits, which makes IFFB% a fairly unstable statistic in small samples. And sure enough, a lot of the guys on this list (Brueser, Guldberg, Cross, Maciel) haven’t gotten regular playing time. The others are thus the more relevant players to analyze.
Euribiel Angeles leads the system in infield fly balls hit, with 26, and these popups seem to have been an issue for his whole career (in the Padres organization prior to 2022). His swing is built more for slashing and lining the ball all over the field, but his swing-at-everything approach (more on this in Part 5 in a few days) and his swing’s tendency to get loopier lower in the zone might be big parts of this problem. Buelvas has a lesser version of some of these issues too and has gotten a bit homer-happy, though he was making some progress on a two-strike approach in May before getting injured. Paulino’s on yet another flyball list here; he has more of a grooved bath path and struggles to adjust the barrel, largely because he doesn’t have much flexibility in his lower half, so he gets under pitches a lot. The same applies to Brueser.
Line Drive Rate
Line drive rate is another statistic that takes a long time to stabilize, so I’m going to take these numbers with a grain of salt to a large extent as well. We also have the classification issue of what counts as a line drive vs. a fly ball, which can vary based on who’s classifying the data. In fact, that might be an issue here:

Six Aviators pace the list, which includes no Lugnuts other than split-season Brett Harris (Lawrence Butler is the current Lansing leader at 24.41%, 15th in the org), and only one Port, eighth-ranking C.J. Rodriguez. Fernandez did have a line-drive rate over 30% with the Giants’ Double-A team last year, so there is at least a 400-PA stretch of this kind of dominance for him. McDonald, Mondou, Allen, and Gelof do all have liner-focused approaches to hitting and have posted average or better rates over the past couple of years. Lopes manages to appear on both this list and the flyball one, so he really doesn’t like to hit grounders, with an average launch angle up around 20 degrees, (in the 90th percentile range). Logan Davidson is the only player on this list who hasn’t posted a BABIP figure above .300, a sign that maybe his overall offensive numbers lag behind what you might expect from his hit distribution. He, Lopes, and (in a small sample) McDonald are the only players on this list who have had offensive struggles this season.
Pull Rate
Now, we’ll move away from what type of ball was hit to where it was hit–the pull side, up the middle, or the other way. Here are the A’s system’s leaders in pull rate:

There is still some small-sample presence on this leaderboard, as McDonald, Guldberg, and Cross aren’t near 100 PA yet and Armenteros has only put the ball in play 47 times. It’s particularly surprising to see McDonald and Guldberg on this list based on their contact-oriented skillsets; McDonald has been more all-fields oriented at previous stops, though this is actually quite in line with Guldberg’s 2021 hit distribution.
The second half all have larger samples and are more clearly pull-oriented power hitters, including two of the flyball leaders. I’m surprised that Richards ranks quite this high, as he seems to have some solid plate coverage, but he was around 50% last year as well, and clearly he’s starting to get to power for the first time in his career, so something is working. Perez also has plus raw power, but he also doesn’t have much bat control, with the rotational action in his swing often pulling him off line. A recent adjustment with his hands starting higher, off his shoulder, seems to be helping. Eierman’s run into a lot of the same issues as Perez. Davidson has less of a pull-oriented history and is more of a line-drive hitter, but he is clearing his hips earlier this year than before, when he would get too passive and let the ball get too deep on him. You have to love that a guy named Brueser is a big first baseman among the organizational leaders in fly ball rate and pull rate.
Up-The-Middle Rate
This is a weird stat to try to make sense of, but while we’re talking about pulling the ball vs. hitting it the other way, it makes sense to see what’s there in terms of up-the-middle rate.

Hmm. Most of this looks pretty legitimate to me, in terms of which hitters I might think might hit a lot of stuff back up the middle. Schwarz leads the pack by a mile and does have a pretty balanced approach to hitting, though he was just at 27% last year; I’d expect he’ll regress toward that. McDonald and Diaz have solid plate coverage and don’t always sell out to pull, with Diaz in particular showing all-fields power, and McGuire is a patient line-drive contact hitter. It’s Armenteros, Butler, and Garcia who strike me as surprising, as I tend to bucket them as pull power guys, but Butler actually has a fairly extended history of being up near 30% here. Armenteros does have all-fields power but has had career-long issues getting out in front of offspeed pitches; he’s tended to be closer to average in this statistic in the past. This is also a touch high for Garcia, who has similar swing-and-miss tendencies against breaking stuff, though he’s been in the 26-27% range for the last several years.
Opposite Field Rate
So now we’ll turn to the final group of where the ball can be hit: going the other way. Here are the A’s minor leaguers who do this most frequently:

The top six guys (and eleven of the top fourteen) are infielders, and there’s a large group of lefties (five and a switch-hitter; #11 and #12 are also LHBs). There are some clear advantages to lefties going oppo relative to righties, in that it’s easier to beat out infield hits or force tougher throws, and the preponderance of middle infield types reflects the contact-oriented nature of this group as well. With the exception of McColl and to some extent Greer, these are basically all contact-oriented hitters. Many are not having particularly strong seasons, but Swift and Mondou have made this approach work quite well, and Jonny Butler is holding his own in High-A in his first full season. Schofield-Sam, Winkler, and especially McColl have enough pop in their bats that they’d probably be better served pulling the ball at least somewhat more; I expect Winkler’s opposite-field rate will decline as his season sample increases, seeing as he just returned from a lengthy injury absence.
Interestingly, the average BABIP of these 10 hitters is just .295; the top 10 pull guys were at .331, and the top ten up-the-middle players were at .334. That does seem to reflect that struggling to catch up to and barrel velocity can be intertwined with this particular statistic, though it obviously isn’t in all cases.
Home Runs Per Fly Ball
HR/FB% is still a small-sample statistic at this point in the season, but it can give us a different interpretation of power than raw number of home runs does, because it strips the hit tool out of the equation to a more significant extent. Here are the A’s org’s HR/FB% leaders:

Armenteros is out here with a 43% strikeout rate and a .396 wOBA, which is about as incompatible a pair of statistics as you’ll see, but this is why. He’s up high on the organizational fly ball rate leaderboard on the occasions he does make contact, and those fly balls tend to fly over the fence. Mickey McDonald is a fluke; he’s so GB/LD-heavy that he’s only lofted seven fly balls this year, and two have flown over the fence, which incredibly ties his career high for homers in a season. It’s been an incredibly low-power career overall for a guy who stands 6’2” and made the big leagues; playing in MLB with just seven career minor league homers is usually a distinction reserved for guys who look like Billy Burns. Any ability for McDonald to get more toward even ten-homer power would go a long way toward cementing his big league possibilities.
Other than McDonald, this is more or less a tour of the top raw power bats in the system, though it’s a mix of high-strikeout uppercut guys who mash the ball when they do manage to loft it (Armenteros, McCann, Eierman, and to some extent Fernandez) and guys who have more of a balanced offensive approach but nevertheless possess serious offensive punch. It’s worth noting this is not a group of players with especially high flyball tendencies; even if you exclude McDonald, just five of the remaining nine hitters are above the organizational median in groundball rate (McCann, Diaz, Muncy, Davidson, and Soderstrom). That might hint at some possibilities for those players to further break out if they can get their groundball rates down toward the 40 percent area. On the other hand, the fact that McDonald, Kelly, Davidson, and Eierman haven’t cracked the 90 wRC+ mark this season despite getting to this much of their power in games is a sign that something else has to take a step forward for them to gain offensive value. Kelly’s appearance on here is notable in the sense that he is the only hitter on the list who has hit more balls the other way (38.71%) than to the pull side (33.33%), with Soderstrom (39.24% pull) as the only other player on the list who doesn’t crack a 40% pull rate.
Batting Average on Balls in Play
Finally, we get to BABIP, which–in a 2.5 month sample–functions as an interesting confluence of actual BABIP skill–hitting the ball hard, hitting lots of liners and grounders, beating out infield hits, etc.–and “hitting it where they ain’t”-style luck. For this statistic, we’ll look at both the top ten and bottom ten performers in the organization and see what trends we can glean from each. First, the leaders:

The most surprising thing about this list, to me, is that it includes only one Stockton Port, Denzel Clarke. Not only do the Ports play in probably the second-friendliest offensive environment of Oakland’s four full-season affiliates, they also–by virtue of being the lowest level–play against the least efficient defenses. The Cal League as a whole has a .325 BABIP this year, compared to .301 for the Midwest League, .315 for the Texas League, and .320 for the Pacific Coast League, but we actually get two Lansing guys represented on here (and Jared McDonald and Gabriel Maciel place 11th and 12th), as well as a robust group of Midland guys.
Of course, there likely is some element of luck in many of these BABIP performances. Guldberg (injury) and Armenteros and Fernandez (intermittent playing time and Three True Outcome-heavy performance) can be grouped into a small-sample suspicion bucket, but we’ve covered Fernandez’s absurd line-drive rate and Armenteros’ strong power on contact already, and Guldberg presents some solid hit-tool characteristics as well. Bride, Schuemann, and Gelof all have showed bigtime feel for the barrel for a couple of years now, and Mondou has clearly developed the ability to line Triple-A pitches to the opposite field. Drew Jackson and Lawrence Butler are the two guys who I might deem the most surprising entries on this list at first glance. Jackson has the lowest line-drive rate on the list (18.57%); though he’s a groundball-heavy hitter who runs well, he doesn’t have much of a history of elevated BABIPs. Butler, though, actually does, posting a similar figure to this last year (mostly in Stockton) and mustering a strong line drive rate in spite of striking out about a third of the time.
All of the hitters on this list except Jackson (87 wRC+) have had strong seasons from an overall statistical perspective, though Butler (107) and Mondou (106) have clearly needed these strong BABIPs to achieve their above-average performances. Otherwise, though, this list comprises many of the best offensive performances in the system, with four of the top five prospect-eligible hitters in wRC+ (Bride, Schuemann, Armenteros, and Clarke). If we wanted to look for top performers who haven’t had BABIPs, say, more than 25 points above league average, Jordan Diaz (.318 BABIP, 126 wRC+), Max Muncy (.331, 124), Shane McGuire (.320, 120), Shea Langeliers (.317, 115), and Kevin Richards (.331, 113) are the names who jump out.
On the negative side, we have…

Again, there are some small-sample guys (Cross, Uhl, and Valenzuela in particular). Ricciardi, Wright, and Valenzuela are all undersized middle infielders who have struggled to impact the ball; Wright has some potential to do so and hit .330 in Rookie ball in 2019, but has too aggressive of an approach right now and gets himself out by weakly rolling over chase pitches. Cross has good pull power but has flown out to the warning track a seemingly inordinate number of times this year, so there’s some bad luck in his organization-worst figure here, though he also pops the ball up a lot. Only Beck and Selman have average or better line-drive rates, and especially Beck has looked unlucky this year, with a lot of hard-hit balls of all types that have found their way into gloves; the underlying data on his performance in Lansing was thus likely a key factor in the organization’s decision to promote him to Midland last week. Eierman’s BABIP was over 100 points higher last year and he’s obviously getting to his power, though his flyball-heavy profile and pre-2021 performance doesn’t suggest he should be much over .290 or so. Buelvas has more feel for contact than most of the other players on this list, but he struggled to a .253 BABIP in Stockton last year before posting this figure. There’s been some concern that he’s focused too much on maximizing his average power, as he’s lofted the ball into the air more and more as his career has progressed but has had very poor line drive rates since getting to full-season ball last year.
Tomorrow, we’ll look at how the system’s pitchers stack up on these same batted-ball metrics.
Comments